Browser extension
Uniform provides a browser extension for Google Chrome that enables users to interact with Uniform Context.
tip
You can catch up with the previous steps using the following links.
Be sure to set the environment variables in the file .env
- StackBlitz - Open the code in a web container that runs entirely in your browser.
- GitHub - Clone the repo on your own machine.
Install extension
The Uniform Context browser extension is available on the Chrome Web Store.
Enable extension
If you pin the Uniform Context browser extension to your toolbar, you will notice the extension is grayed out. This is because the extension can't detect Context in the app.
But Context is enabled in the app, so what's going on? Context must be enabled to make data available to the extension.

Edit the following file:
- Next.js
import { UniformContext } from "@uniformdev/context-react";
import { Context, enableContextDevTools } from "@uniformdev/context";

import manifest from "../lib/contextManifest.json";

import "../styles/globals.css";
import "../styles/page.css";

const context = new Context({
  manifest,
  defaultConsent: true,
  plugins: [
    enableContextDevTools(),
  ]
 });

function MyApp({ Component, pageProps }) {
  return (
    <UniformContext context={context}>
      <Component {...pageProps} />
    </UniformContext>
  );
}

export default MyApp;
About these changes
This adds a plugin to Context that exposes the data it collects to Chrome's DevTools, where the Uniform extension can read it.
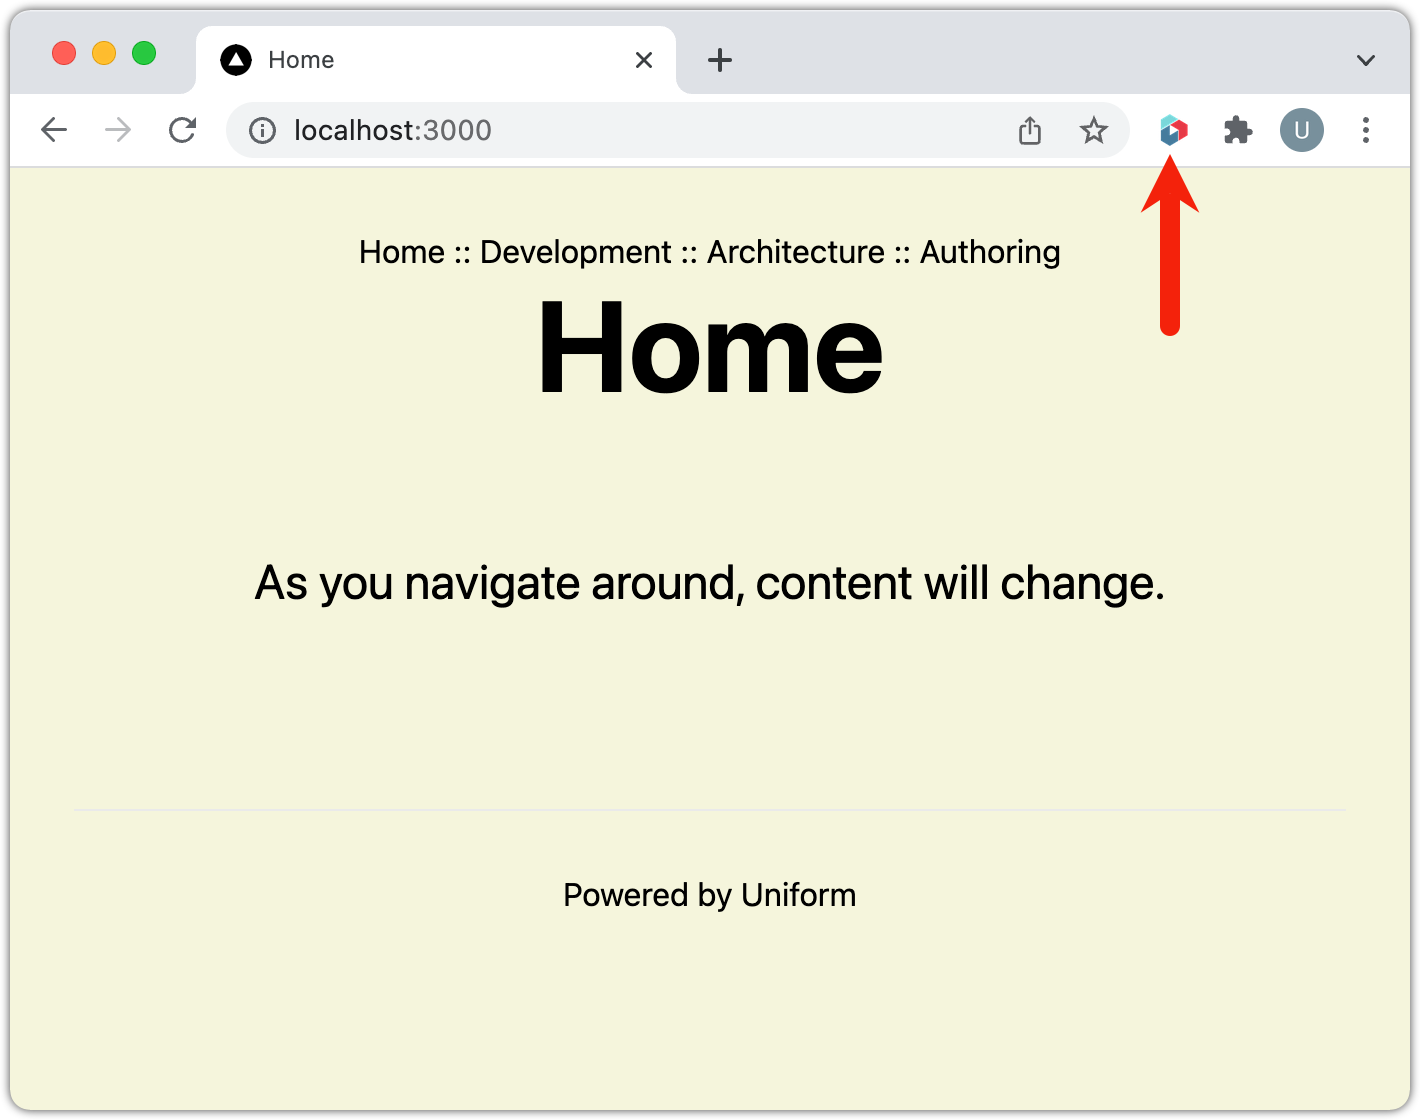
Now the browser extension shows the Uniform symbol in color. This indicates the tracker is loaded.
info
If you click the browser extension button, you will not see any information. This is because there is no information to show. In the next section you will configure Uniform so data starts to get collected.
Enable logging
Context can be configured to log its activity to the browser. In addition to being a useful troubleshooting tool, this can also be a good way to better understand what Context is doing.
Logging can be enabled through the browser extension. Using this approach, messages are written to the browser's console.
tip
Logging can also be enabled through code, but that has two disadvantages. First, you have to make a code change. Second, this code will increase the bundle size of your application.
Open the browser extension.
Click Settings
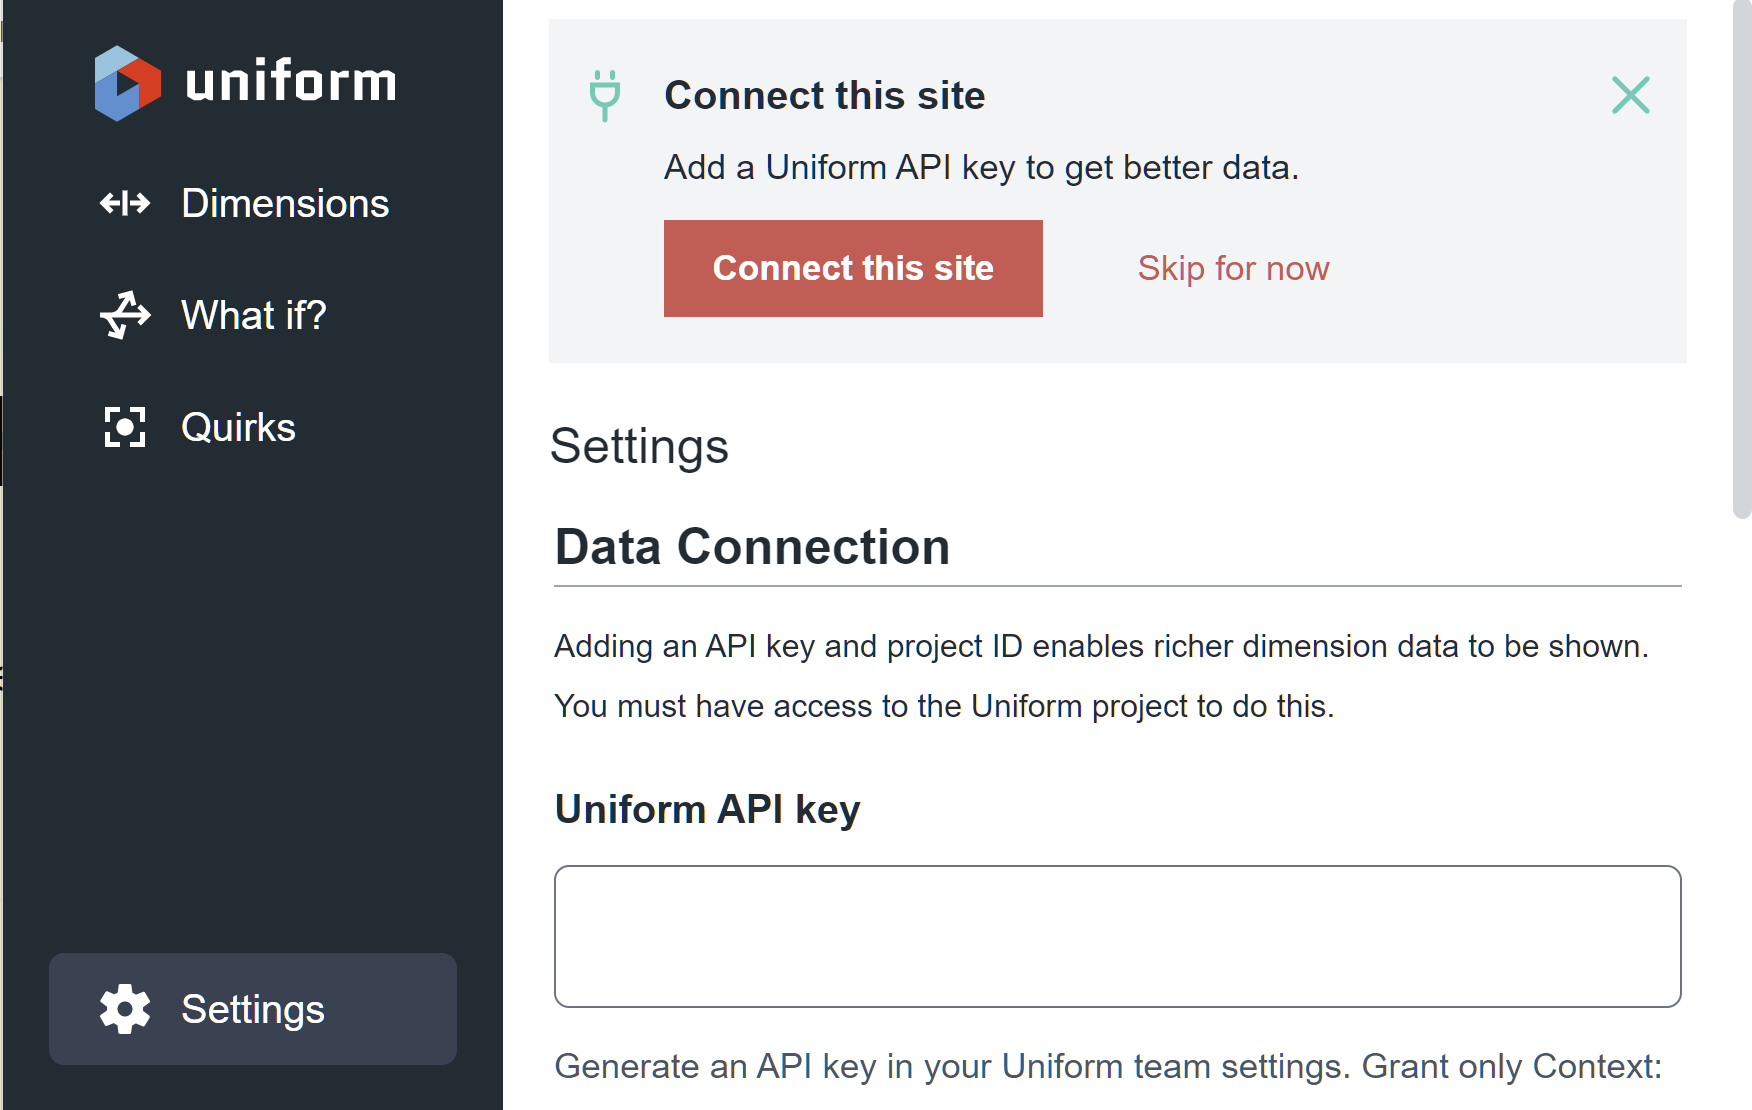
Use the field Logging to select the level of detail you want logged.
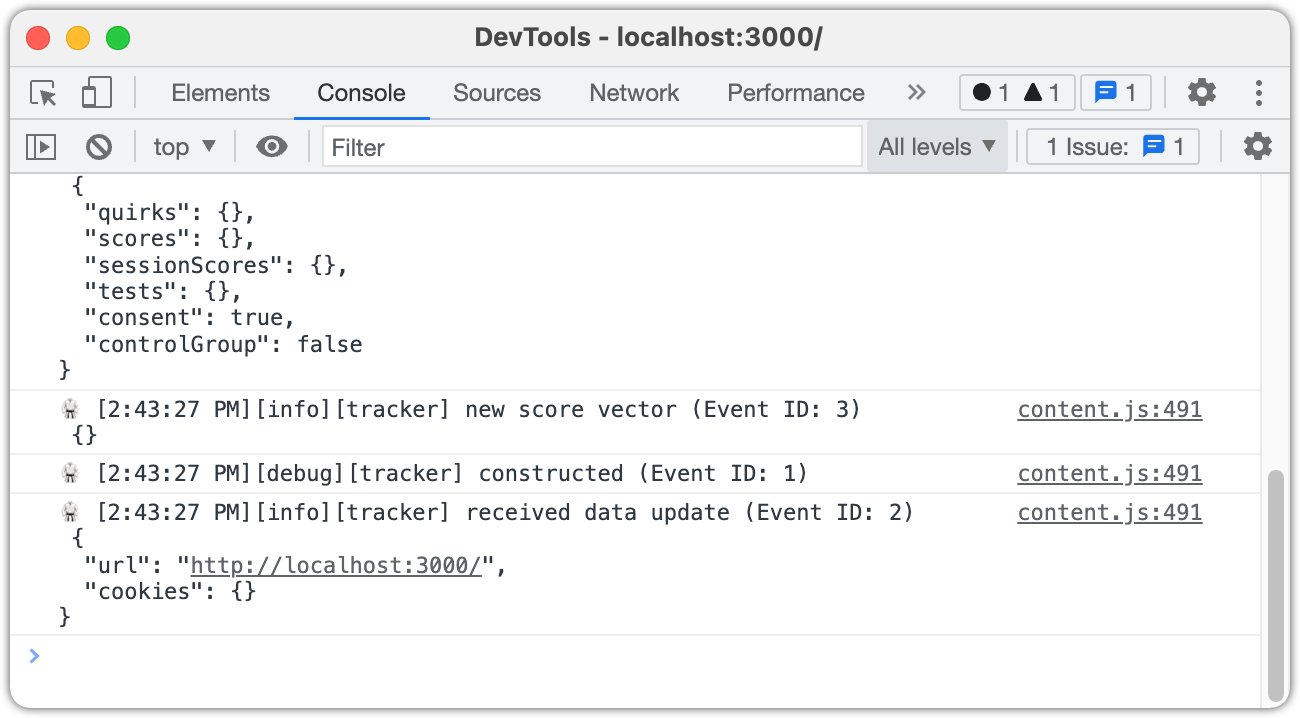
Now you will see messages written to the console.
Enable verbose logging
Verbose is the most detailed level of logging, but the default browser settings has verbose logging disabled. The following instructions describe how to enable verbose logging.
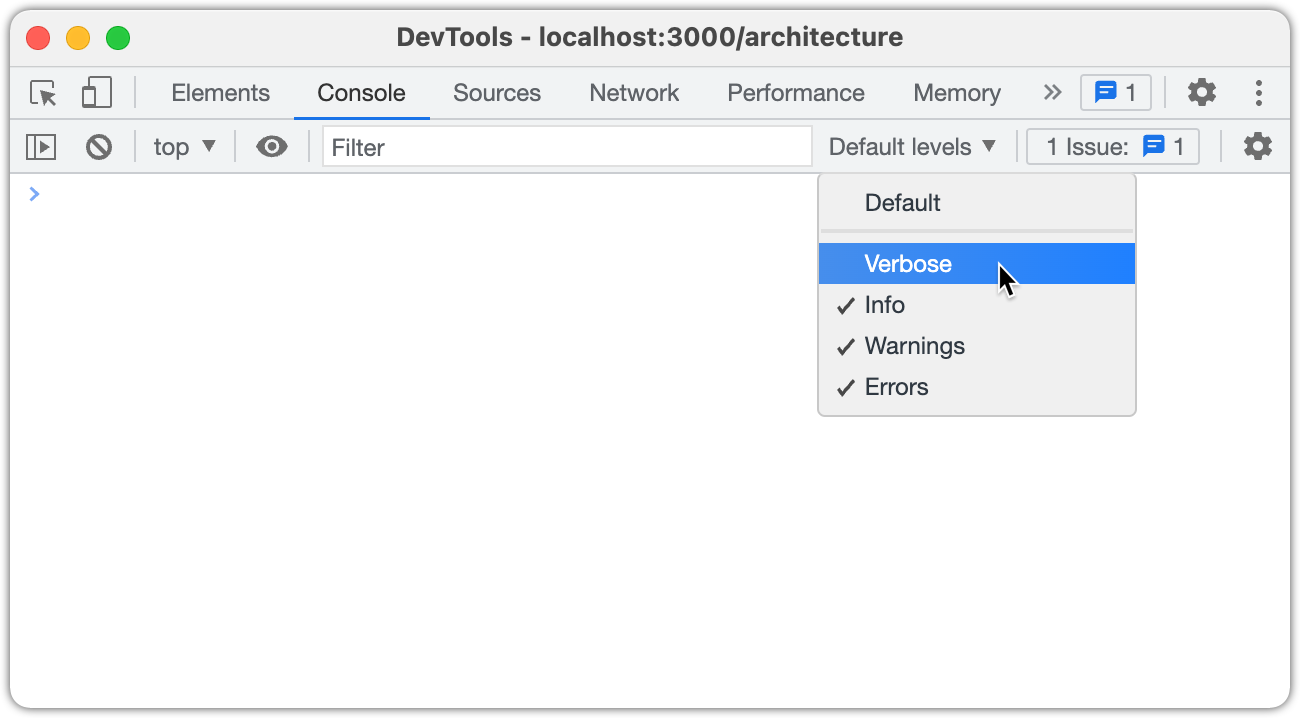
Open your browser's DevTools console.
Select the Console tab.
Select Default levels > Verbose
Finished code
The application with all of the steps to this point is available here:
- StackBlitz - Open the code in a web container that runs entirely in your browser.
- GitHub - Clone the repo on your own machine.
tip
Be sure to set the environment variables in the file .env